Price Action + Market Structure Masterclass

I’m a former Prop Trader and I’ve been trading Crypto for 8 years.
Basic understanding of price action concepts is something that every good trader that I’ve spoken to has in common.
So the goal of this article is to try simplify the basics and pass it over to you. 🤝
Here is everything that you’re going to get in this Article ↓
- Lesson 1: How does Price actually move?
- Lesson 2: Support and Resistance
- Lesson 3: Ranging Structure and Trending Structure
- Lesson 4: Live Trade Examples + 5 Bonus Resources
**🤓**NOTE TO READER: I have done my best to simplify all of these concepts as much as possible. Enjoy~
Lesson 1: How Does Price Actually Move?
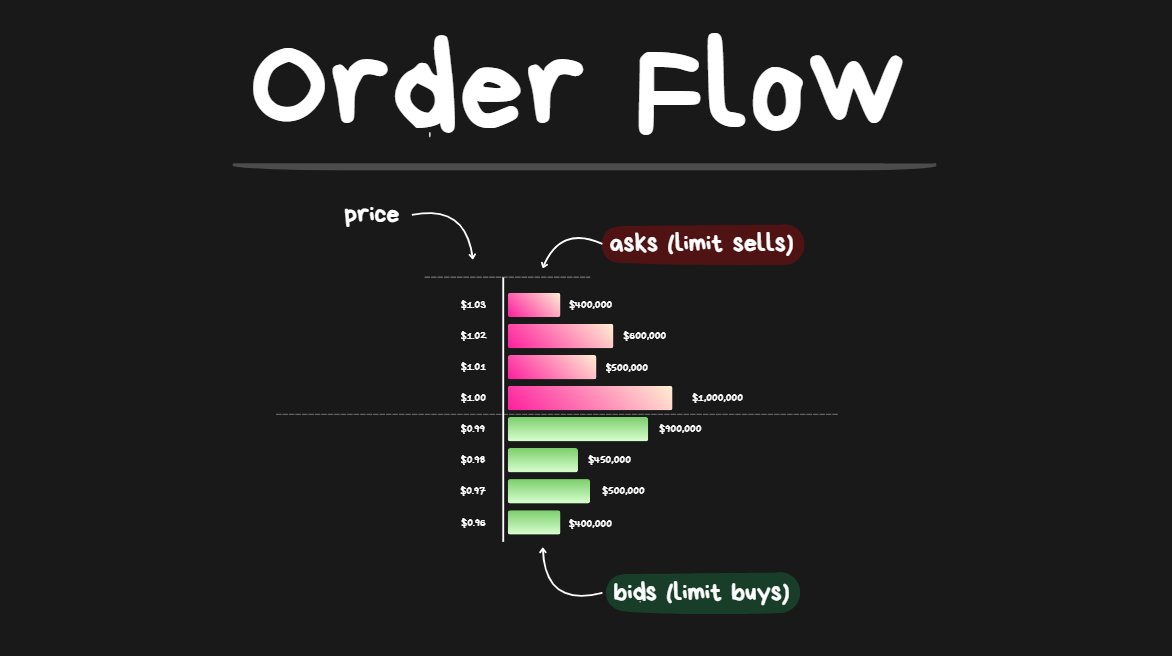
orderbook
🤓NOTE TO READER: There is a reason why I want to cover this lesson first.
Unfortunately the majority of Traders don’t actually understand the causes for price moving up/down.
There are even some Traders out there who believe that the elites of society created a dark secret predatory algorithm which controls all the price movements in the market and it is designed to hunt stoplosses at certain times of the day….(yes seriously… there are surprisingly a large number of people out there who actually believe this.)
I can assure you, the market is not a “super coded algorithm by the elites”… it is a lot more like an auction at eBay.
If the most basic understanding of markets is incorrect or misguided, then all other ideas that the trader is going to come up with are going to be sitting on a very unstable foundation.
The goal of this lesson is to at least get the basics right. That’s it.
Okay let’s jump into the lesson ↓
This lesson will cover:
- What even is a “Market”
- Makers and Takers (limit orders/market orders)
- What causes the price to move and how does it happen
What Even Is a “Market”?
As soon as someone is willing to buy something, a market now exists for that something.
- If someone wants to buy a specific Pokemon card, then there is a “market” for that specific Pokemon card.
- If someone wants to buy an apple, then there is a “market” for apples.
- If someone wants to buy a burger, then there is a “market” for burgers.
- If someone wants to buy crypto shitcoins, then there is a “market” for crypto shitcoins.
A thing doesn’t need to be listed on an exchange with fancy candlestick charts and liquidity providers for it to have a market.
As long as someone wants to buy something then a market technically exists for it.
Makers and Takers (Limit Orders / Market Orders)
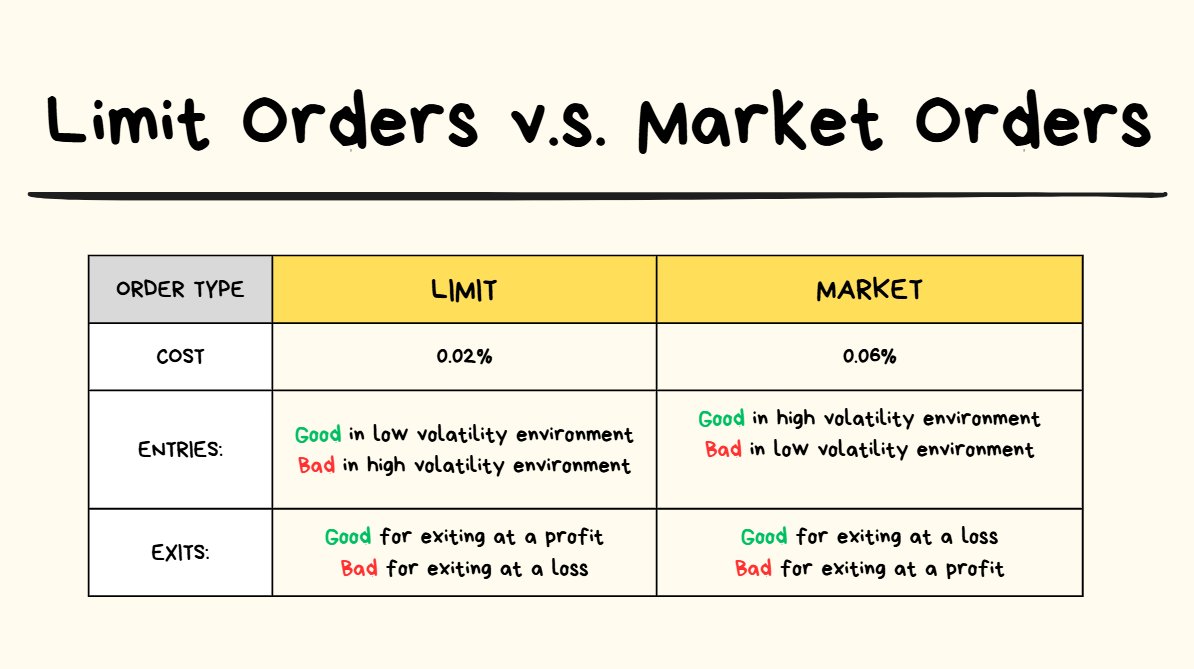
order types cheat sheet
In ALL markets there are Makers and Takers.
Maker:
- someone who is advertising to buy or sell “something” at a specific price.
- Example: “Bob is willing to sell 2 apples for $1 each.”
- The Maker may need to patiently wait for another market participant to see their advertisement and make a transaction with them.
Taker:
- The Taker is someone sees the advertisement of the Maker and agrees to the price.
- They will make the transaction with the Maker at whatever price the Maker wanted.
- But the Taker gets to decide on the quantity of how much of the thing they wanted to transact.
- Example: “Timmy agrees to Bob’s price of apples at $1 each, but Timmy only purchases 1 apple. Timmy gives Bob $1 and immediately receives 1 apple in exchange.”
In the Crypto Markets, “Makers” are those who are putting limit orders onto an orderbook. If you were to put in a “limit buy order for 1 BTC at $90,000” then you order will be sitting on the orderbook until price drops down to it.
❗️TIP: “Liquidity” is just a fancy way of saying “how much money is there sitting in limit orders.”
“Takers” are the ones who will be using market orders to execute against the resting limit orders. When you execute a Market Order, you don’t get to choose the price that you get. If you want to “market sell 1 BTC”, your order for 1 BTC will execute at whatever the best limit buy orders are available at the time.
What Causes Price to Move?
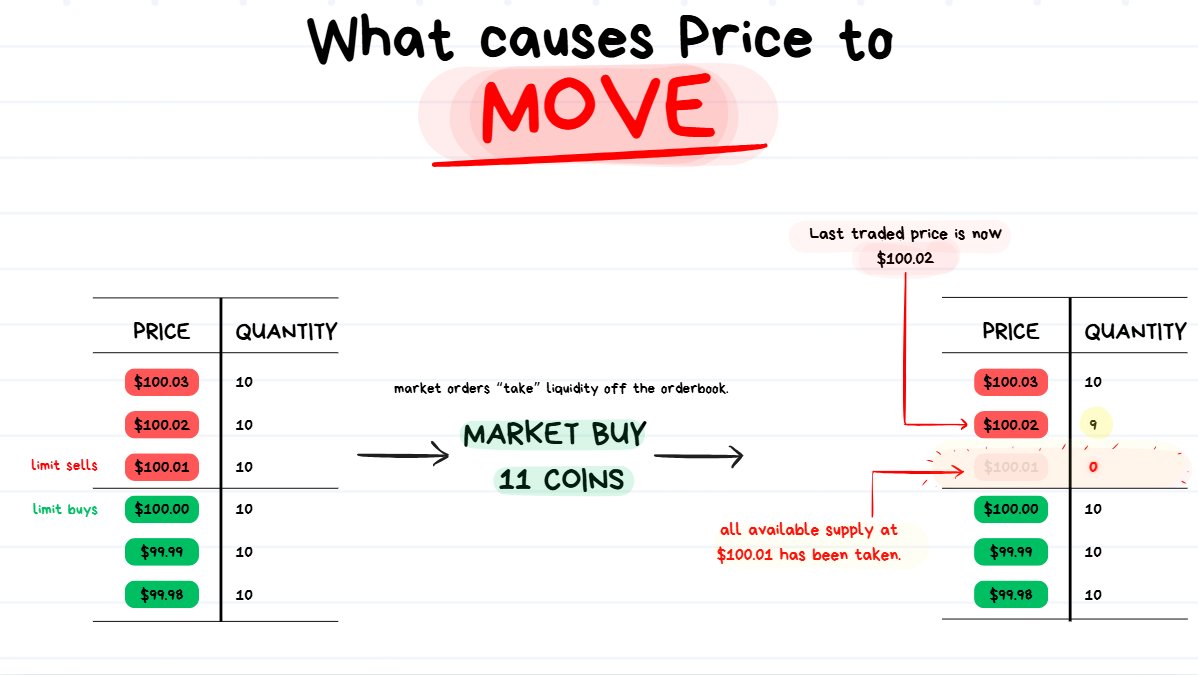
Market moves based on Supply and Demand at certain price points.
- Supply = Limit Orders (from makers)
- Demand = Market Orders (from takers)
Below I’m going to explain Supply/Demand using an analogy with Apples 🍎↓
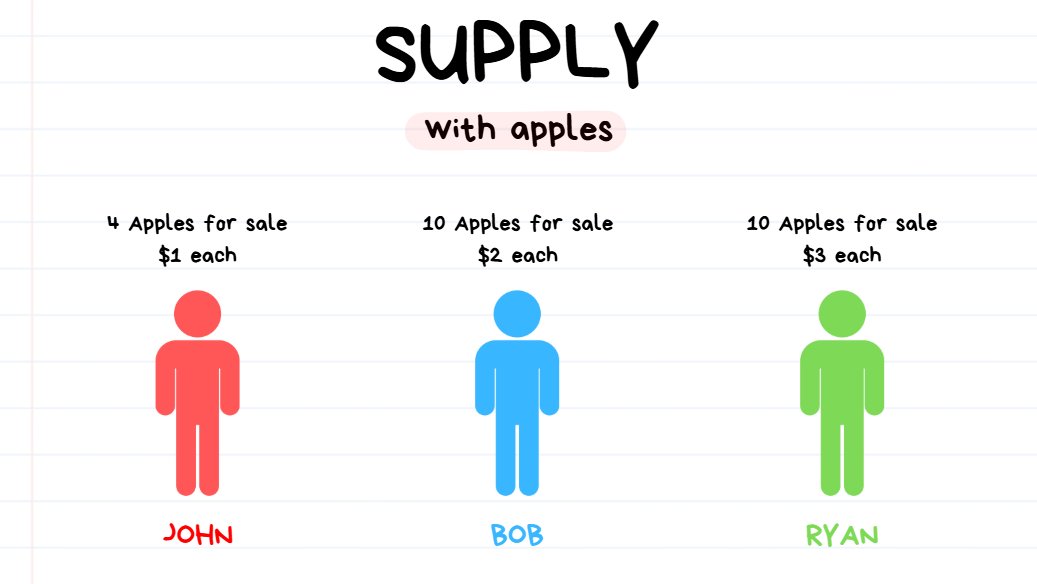
3 traders providing liquidity to apples. (supply)
There are 3 Makers (advertising to sell a specific price/quantity) for Apples:
- John has 4 apples for sale at $1 each.
- Bob has 10 apples for sale at $2 each.
- Ryan has 10 apples for sale at $3 each.
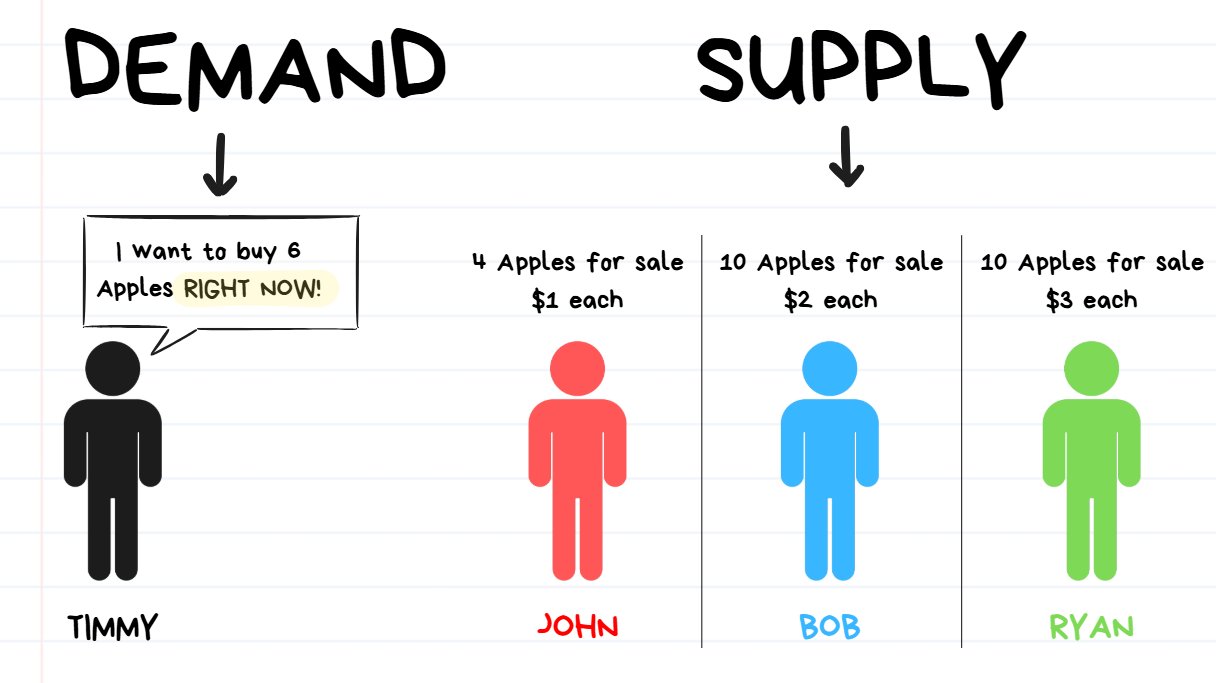
a taker (demand, in the form of market orders) has appeared.
↑ Timmy the Taker has appeared!
Timmy wishes to buy 6 apples immediately. He doesn’t care what price he gets, he just needs 6 apples to cook the best apple pie.
In order for Timmy to act on his intent, he will need to execute a Market Buy for a quantity of 6 apples.
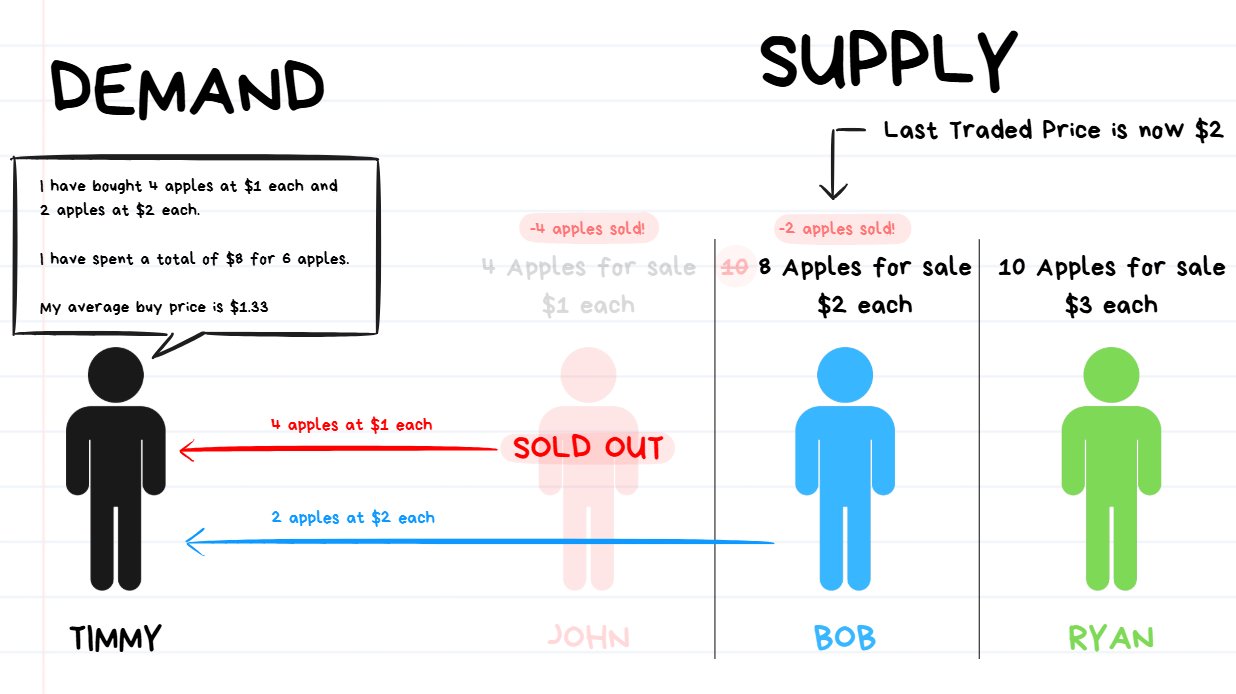
market order for 6 apples has been executed. price moves from $1 up to $2.
Once Timmy executes a Market Order for a quantity of 6 apples, this is what will happen:
- First Timmy’s order will take from the best available limit sell order. This will be the 4 apples from John at $1 each.
- However since John only has 4 apples for sale and Bob wants 6, Bob will eat through ALL of Bob’s supply. Timmy still has 2 apples left to buy.
- The next best available price will be $2 each from Bob. So Timmy will purchase the last 2 apples from Bob.
So Timmy bought 4 apples at $1 each ($4 of liquidity taken) and took all the available supply.
Then Timmy bought another 2 apples at $2 each from Bob ($4 of liquidity taken).
So BEFORE Timmy placed the order, the price of apples was $1.
AFTER Timmy’s Market order finished executing, his order resulted in pushing the price from $1 up to $2 because he ate through all the supply.
❗️TIP: So basically whenever demand exceeds supply at a certain price point, the price will move.
Summary: Lesson 1
Price doesn’t move because of secret algorithms. It moves because of supply and demand between buyers and sellers.
- Markets: A market exists anytime someone wants to buy or sell something. It can be apples, Pokémon cards, or Crypto.
- Makers (limit orders): Provide liquidity by advertising prices they’re willing to buy/sell at.
- Takers (market orders): Remove liquidity by accepting those prices immediately.
Price moves when market orders (demand) consume the available limit orders (supply) at a given price. If a large market buy eats through all sell orders at $1 and starts filling $2 orders, the price rises to $2.
👉 In short: Price = the result of market orders hitting the orderbook.
Lesson 2: Support and Resistance
The topic of support/resistance is a rather simple topic.
Unfortunately, Traders have a unique talent for finding ways to overcomplicate basic concepts and confuse themselves in the mess that they have created.
The goal of this lesson is get crystal clear clarity on Support/Resistance and remove any potential confusions.
This lesson will cover:
- Stop thinking about Magical Lines, start thinking about Limit Orders
- Order Size relative to Volatility
- Swing Highs and Swing Lows
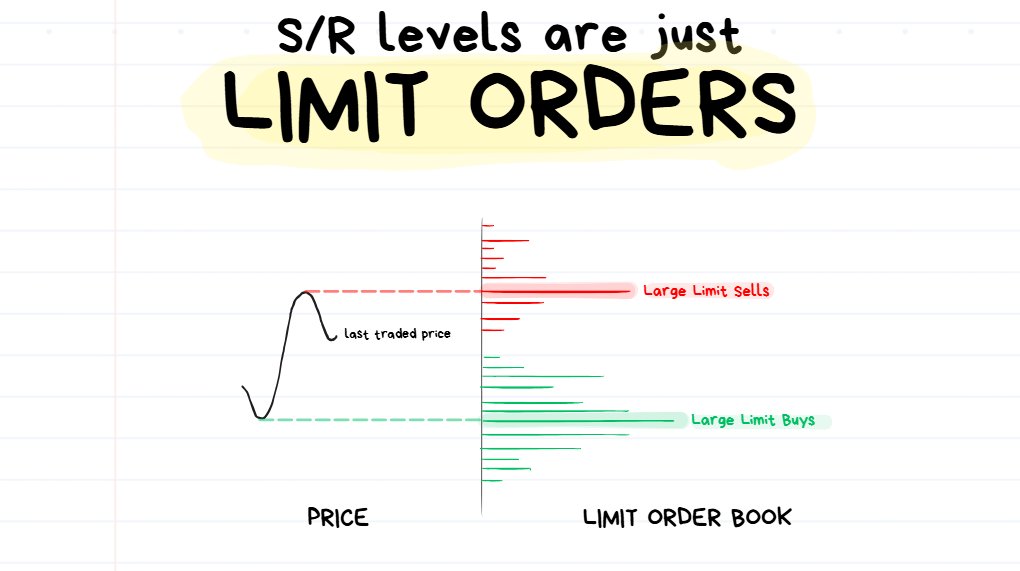
Stop Thinking About Magical Lines, Start Thinking About Limit Orders
price isn’t bouncing from the lines you draw. It’s bouncing from limit orders in the orderbook.
Out in the vast space of social media are a whole bunch of influencers who try to create fancy-sounding ways of drawing different types of support/resistance levels.
Behind all the fancy “order blocks” and “price delivery zones” (or whatever other terms are used) is literally just a bunch of limit orders.
Ultimately, as discussed in the previous lesson, price moves purely based on Limit Orders and Market Orders.
So price is never bouncing off the “magical lines” (or boxes) that you draw on your chart. It is bouncing off the limit orders on the orderbook.
❗️****TIP: The lines that we draw on the chart are just to help us visualize where large clusters of limit orders are sitting.
You will often find big clusters of Limit Orders near previous big turning points in the price action.
The thing is I could draw a random line anywhere on the chart and behind it are probably going to be some limit orders.
This means you can draw literally any line on your chart and you could technically call it a valid support or resistance level.
Order Size Relative to Volatility
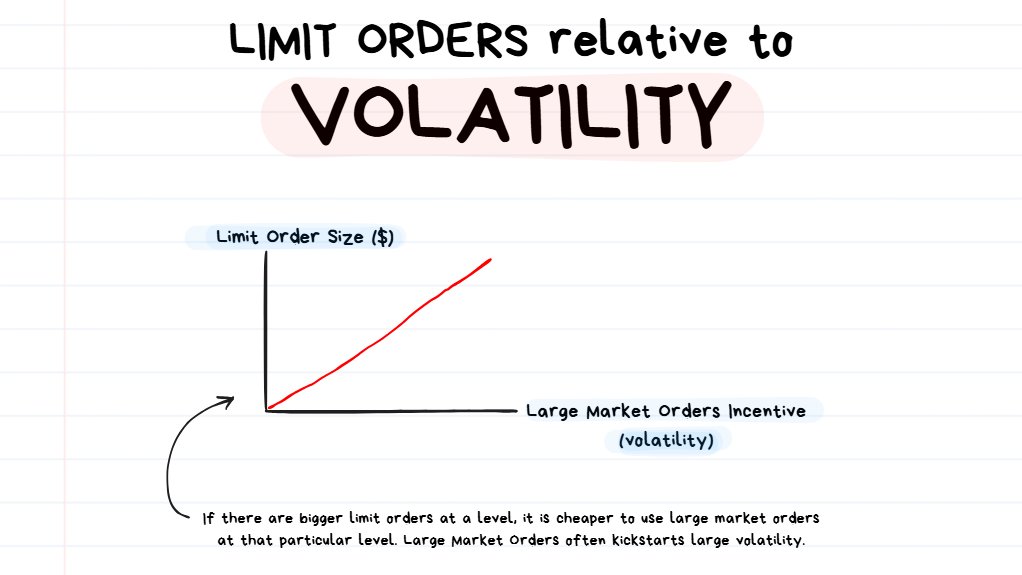
The bigger the advertisement, the louder the market gets after a sale occurs.
If there’s a lot of money in limit orders at 1 price, there’s more incentive to use market orders at that point since the slippage for large orders is at its lowest.
Since market orders are responsible for moving price up/down, we can expect to see a lot of movement once price hits a large limit order and starts moving away from it.
- This means that sometimes price can come into an “interesting looking” level but it just has very few limit orders there… meaning it’s not likely to have a violent reaction to the level.
- This also means that a big limit order can be placed at a very strange and unexpected place in the chart and have a big impact on price action once the price reaches that point.
Quick Summary (with a Hot Take🔥)
So basically there’s no such thing as “strong levels” or “weak levels”… yep I’ve said it. 🤷♂️
It’s not about “weak” or “strong”, it’s just about how much $$ in limit orders is sitting at a level relative to the other nearby limit orders.
More money sitting at a level in limit orders does not necessarily mean a higher likelihood of a “bounce” from the level (which is most commonly assumed).
It just means that we can expect to see a more volatile reaction once price gets closer to the level since big limit orders often incentivize big market orders to come through, which then cause big price movements.
- This means if a reversal happens from a level with huge orders, it’s likely to be a very violent reversal.
- If a breakout happens at the level with huge orders, it’s likely to be a very violent breakout.
If there’s very small limit orders at a level, then regardless if the price reverses or does a breakout it’s unlikely to be a wild move because there just isn’t “that much fuel for the fire to use.”
🧠3 BONUS TIPS ↓
❗️TIP #1: Big/Round Numbers which are in multiples of 10 (e.g. $1, 10, $10, $50… etc.) often have large limit orders stacked on them. This is why we see frequent violent reactions from these levels.
❗️TIP #2: For more advanced (or curious) Traders, you can use the platform @tapesurfapp to see where the limit orders are. I’m not affiliated with them in any way, I just think their platform is super cool.
❗️TIP #3: The more time that price has spent away from a level = the more time the market as a whole has to place limit orders at that level = the bigger the reaction can be expected once price returns to that level again.
Swing Highs and Swing Lows
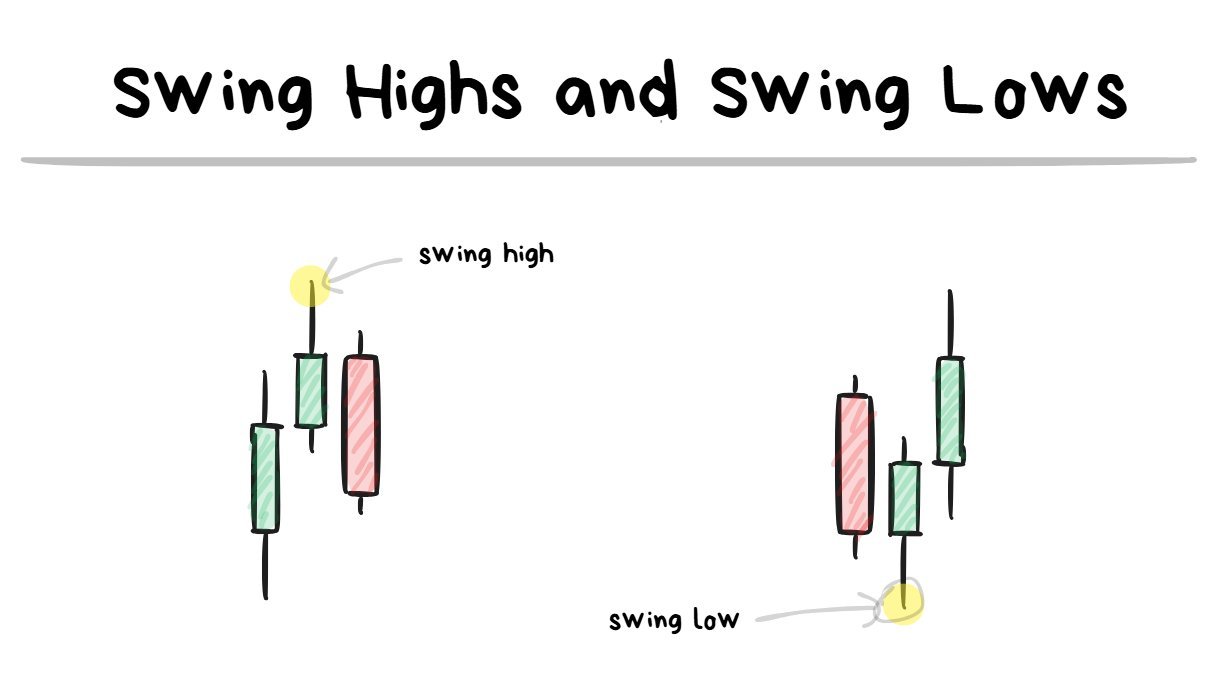
**🤓**NOTE TO READER: A swing point (high or low) requires at least 3 candles to be formed. Swing highs is when the 2nd candle has the highest extreme and a swing Low is when the 2nd candle has the lowest extreme.
These are the easiest price-action based support/resistance levels to use because of how simple it is to identify them and be consistent when using them.
I want to give some Simple Examples of using swing highs/lows below ↓
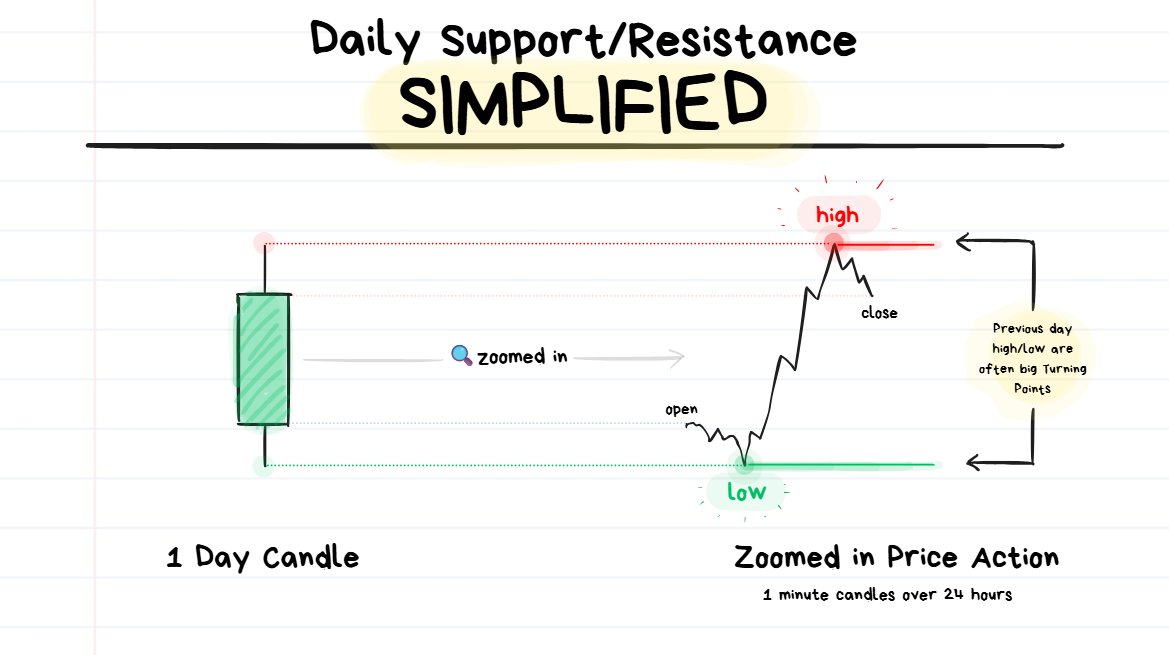
When you are looking at a 1 Day Candlestick and then you zoom into it by changing timeframes, you will get a chart which looks like something on the right hand side of the image above.
The highest and lowest points of the day often have a lot of limit orders placed near them.
A lot of market participants make their decisions based on the highest and lowest points of the day.
It is a frequent used area for traders to enter trades and also exit trades, which often causes there to be a lot of activity around these types of levels.
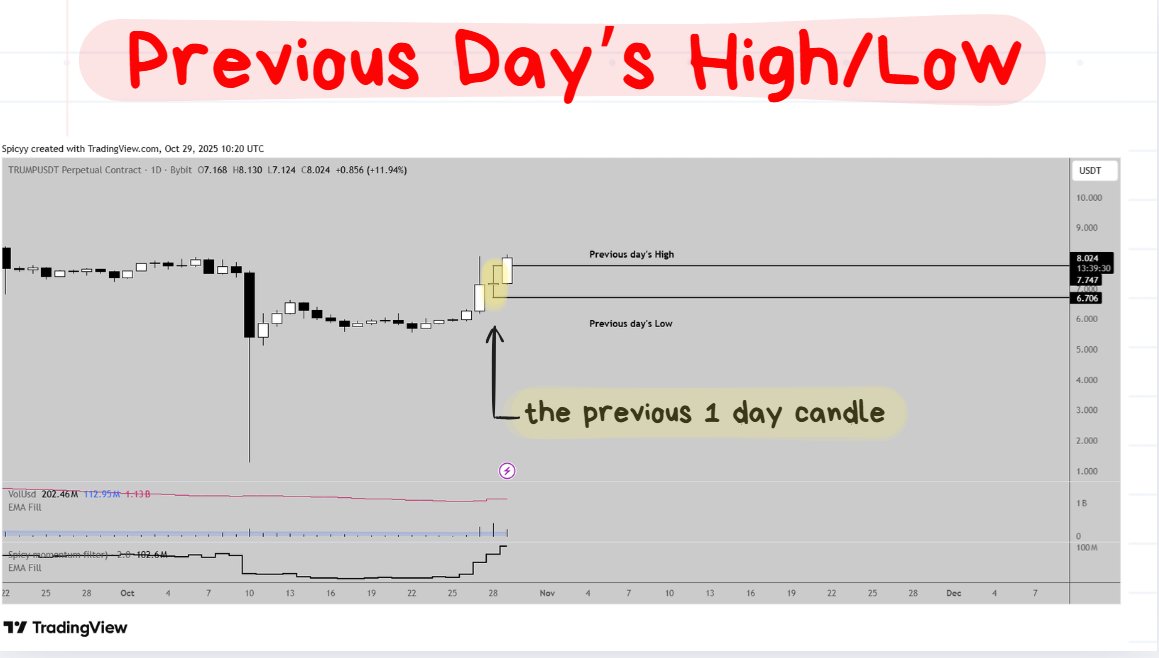
📚EASY EXAMPLE #1: Daily Highs/Lows
https://www.tradingview.com/x/HZgYO69I/
The Previous Day’s High/Low is one of my favorite S/R levels to trade from because of how easy it is to be consistent with execution.
When levels are drawn in the exact same type of way for every single trade, the trades become more consistent.
❗️****TIP: The High/Low of the previous X units of time will always appear as a swing high or a swing low. This is because it is only looking at the extreme points.
As executed trades become more consistent, the trades become easier to review and make improvements to.
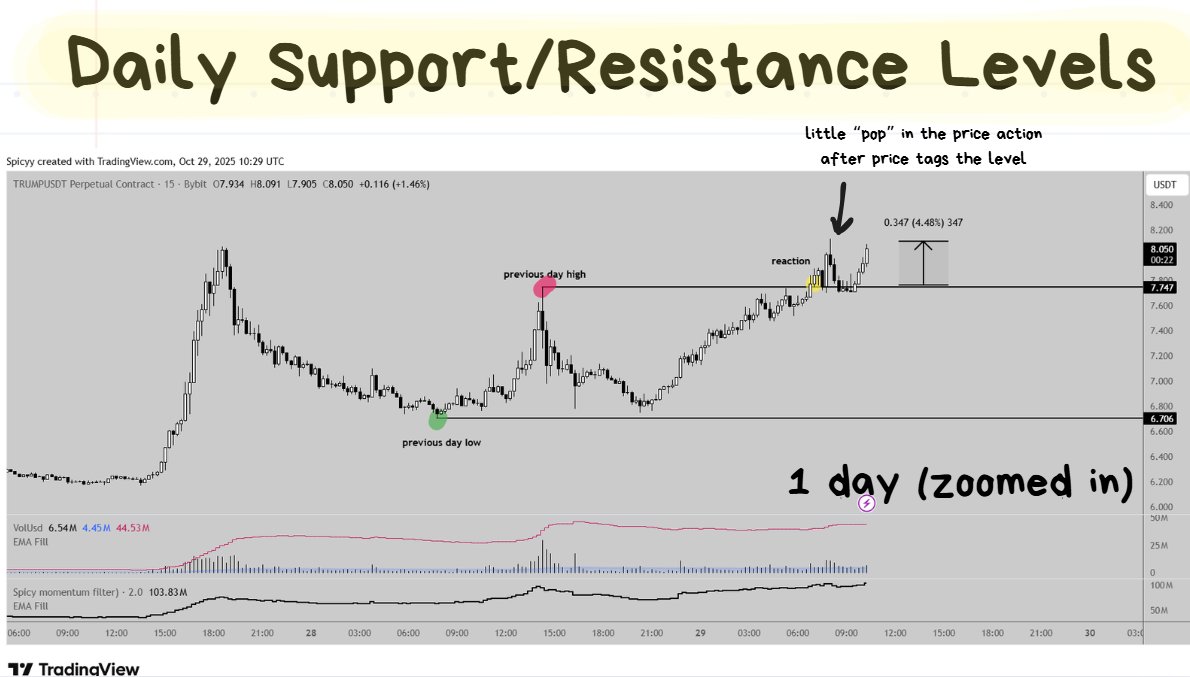
green/red dots (previous day’s high/low) were the key turning points for that 24 hours.
When you zoom into the previous day’s candle by switching to a different timeframe you’ll often be able to see how the previous day’s highs/lows were key turning points throughout the day.
When price returns to a place where a lot of volume was previously executed (which are often the key turning points), it often has a lot of volume executed there once again.
This is why we so often see more violent reactions once price reaches one of these key levels.
📚EASY EXAMPLE #2: Previous 1 Hour Swing Highs/Lows
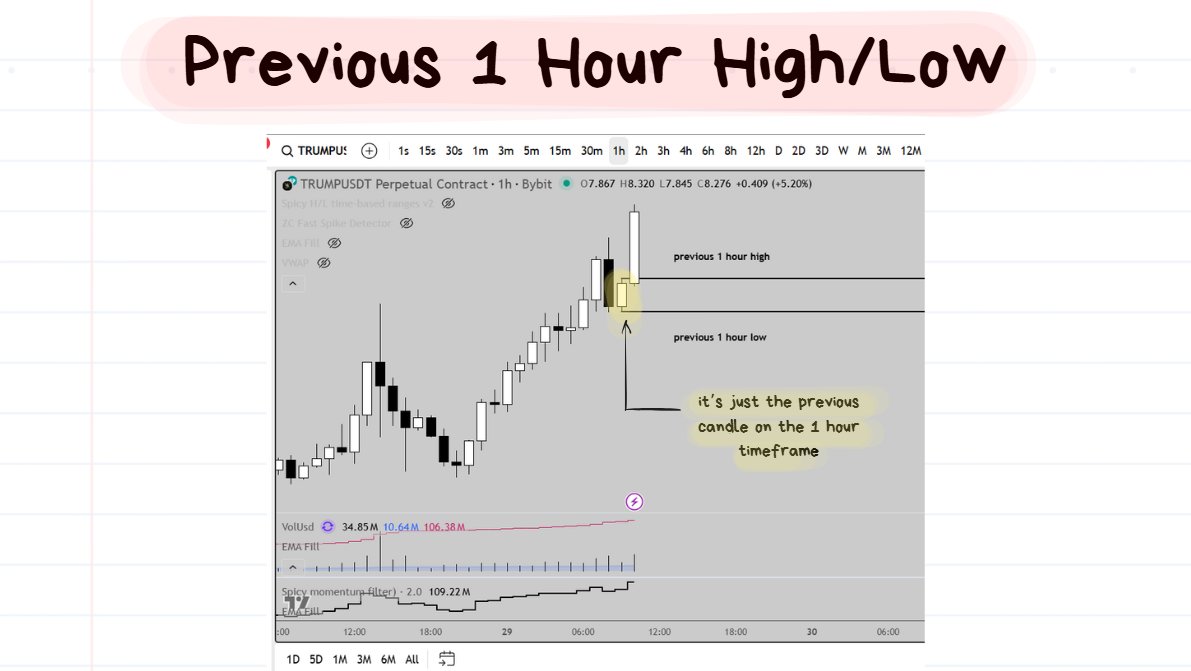
timeframe: 1 hour
Super simple:
Switch to the 1 hour timeframe.
Find the high/low of the previous 1 hour.
❗️****TIP: You can use the Magnet Tool (bottom left hand corner of tradingview) to “snap” to the highs/lows.
Then Zoom into the 1 minute timeframe. ↓
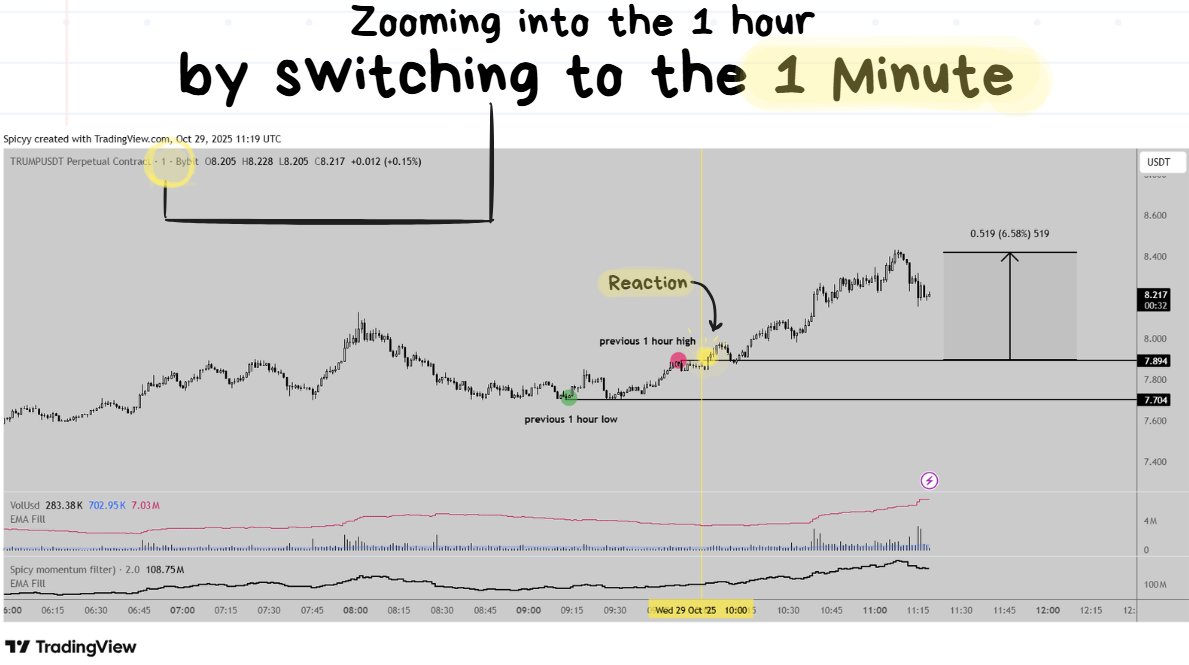
https://www.tradingview.com/x/sj72rlov/
The idea here is the same as the 1 day candles. The highest and lowest points of the previous 1 hour can often have violent reactions.
Summary: Lesson 2
Support and resistance aren’t “magical lines”. They are just clusters of limit orders.
- Core idea: Price reacts at levels where large limit orders sit. The lines we draw only visualize these areas of liquidity.
- Order size vs volatility: Bigger limit orders = bigger reactions once hit. It’s not “strong” or “weak” levels. What matters is just how much money is sitting there relative to nearby prices.
- 3 Tips: - tip1) Round numbers (e.g. $1, $10, $100) often have stacked orders. - tip2) Use tools like TapeSurf to see real limit orders on multiple exchanges. - tip3) The longer price stays away from a level, the stronger the reaction when it returns.
- Swing highs/lows: Simple, consistent S/R levels formed by 3 candles (middle one is the extreme). Daily highs/lows → high activity, great for consistency. Hourly highs/lows → good for intraday reactions.
👉 In short: Support/resistance = where real money (limit orders) sits. Trade from clear swing highs/lows and round-number levels if you want to simplify your execution and also make it more consistent.
Lesson 3: Ranging Structure and Trending Structure
Sep 2, 2025
The 2 main Trading Styles I rely on explained↓
In this lesson we’re going to cover:
- Market Structure
- Break in Market Structure
- Mean-Reverting Markets (ranging)
- Momentum Markets (trending)
- **🧠**Margin of Error (important concept)
🤓NOTE TO READER: Before diving into the lesson I want to give some quick context.
When price approaches any support/resistance level we as Traders have 3 types of decisions that we can make:
- 1 ) I bet that price will break through this level (Momentum)
- 2 ) I bet that price will bounce off this level (Mean Reversion)
- 3 ) I don’t want to bet at all. (No Trade Taken)
Before we take a trade, we have to assess multiple variables to see which of these 3 decisions is the most appropriate to make at the time.
As a Trader you have to get used to picking Option 3… a LOT.
Okay let’s get into the Lesson now ↓
Market Structure
Apr 15, 2025
Market Structure a Simple and Easy thread
Before jumping into a trade it can be quite helpful to have a little bit of context.
Looking at the current Market Structure is a good place to start.
- 🐂Bullish Market Structure: higher highs and higher lows.
- 🐻Bearish Market Structure: lower lows and lower highs.
❗️TIP: Look at the swing highs and swing lows created in the price action when trying to judge the market structure.
Break in Market Structure
Just because price currently has Bullish Structure doesn’t mean that it will just go up forever.
There are going to be times where the structure “breaks” and price can potentially turn around and start moving in another direction.
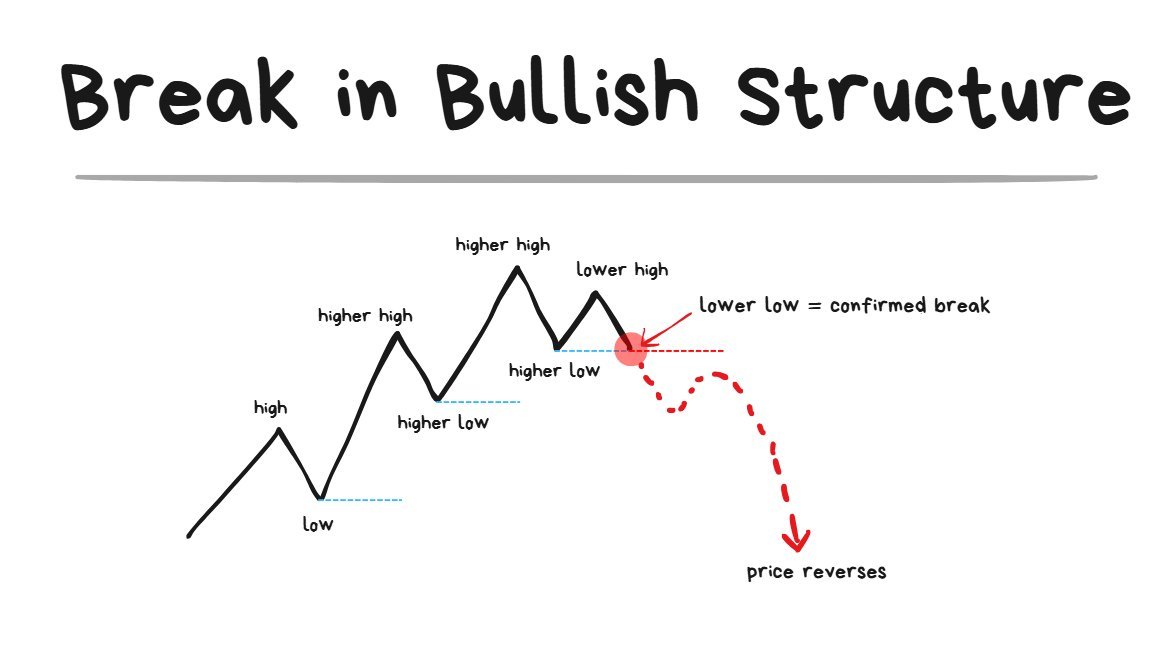
- Just because a Lower High comes in does NOT mean the structure has broken yet
- The structure is only broken when the Lower Low comes in.
- A Lower Low = the break of the most recent swing low that was formed.
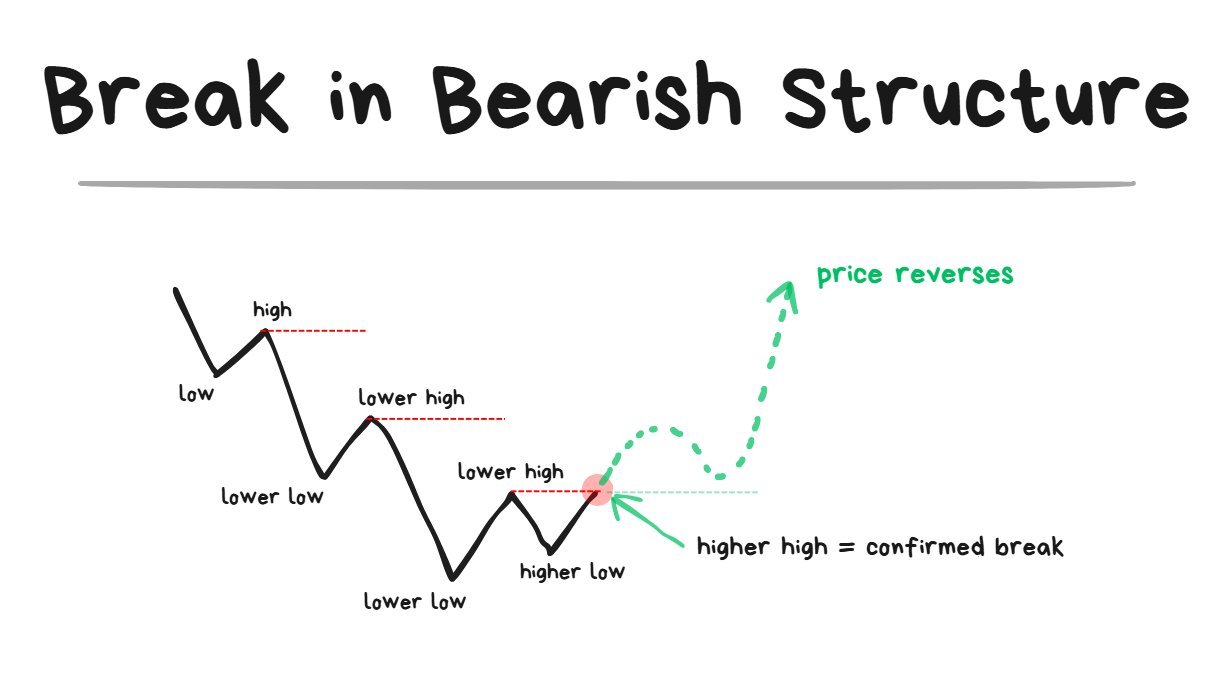
- Just because a Higher Low comes in does NOT mean the structure has broken yet.
- The structure is only broken when the Higher High comes in.
- A Higher High = the breach of the most recent swing high that was formed.
Live Trade Example of using a Break of Structure ↓
Oct 17, 2025
$IP Break of structure after spiking (and almost immediately rejecting) the big $6 level. have a tight FTA on this one (lowkey am thinking that X is not the best place for posting setups… )
Mean-Reverting Markets (Ranging)
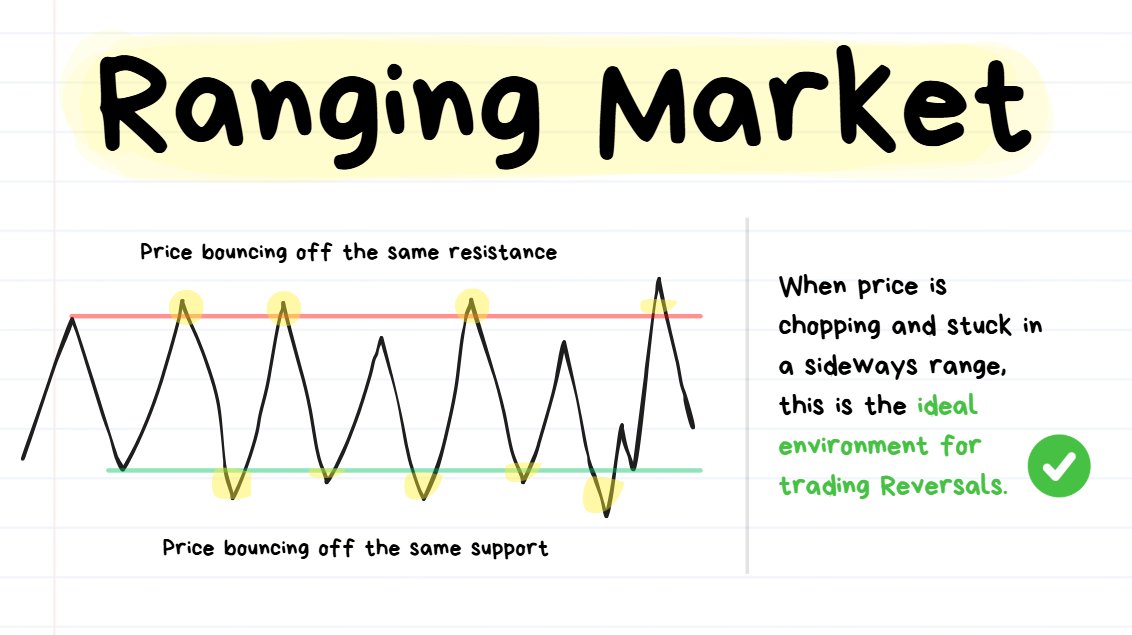
❗️****TIP: **“**Mean Reversion” means “reverting back to the mean” or “reversing back to the average/middle price.”
When the direction of price isn’t clear because it just keeps reversing from the same highs/lows over and over again, this is a Mean Reverting Environment.
This type of environment is:
- ✅the BEST for trading reversals
- ❌the WORST for trading breakouts
Momentum Markets (Trending)
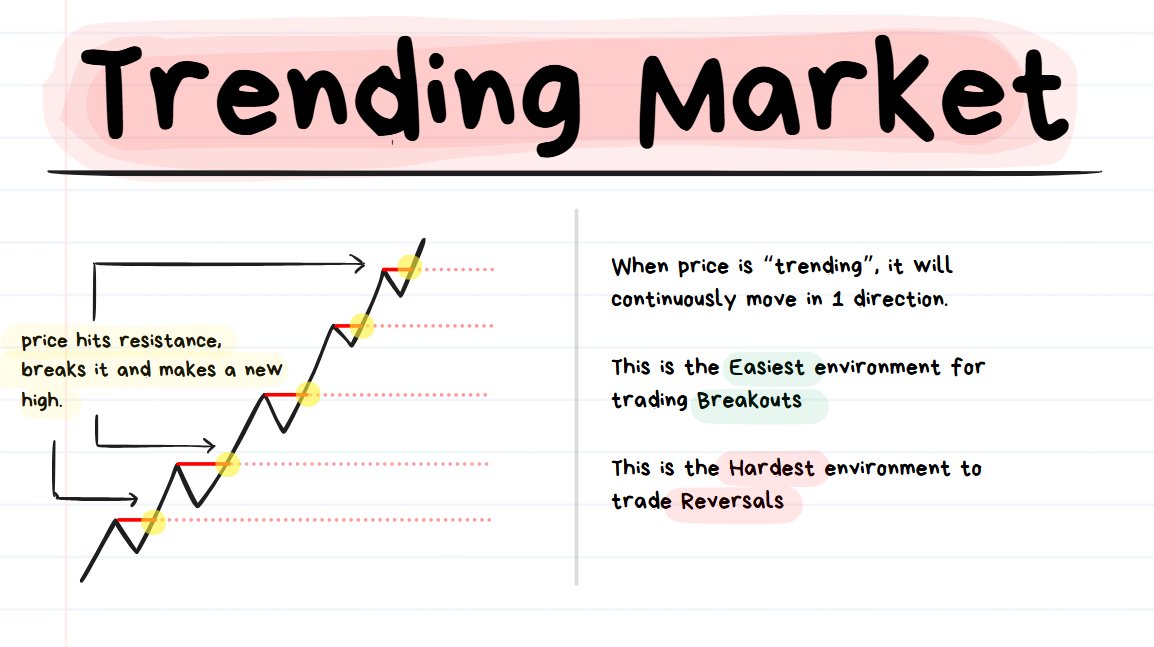
❗️****TIP: “Trending” means that price is consistently moving in 1 direction. If it’s an up trend then price is consistently going up and if it’s a down trend then price is consistently going down.
When the Market Structure of a move appears to be Bullish or Bearish for a consistently long duration of time (it’s more about total # of candles rather than units of time, since this concept holds true for all timeframes), then you’re looking at Trending Price Action.
Common characteristic of strong Trending Price Action:
- Price hits a resistance and then effortlessly breaks through it, drifting to the next resistance.
- Then when it reaches the next level, it breaks through that again and the cycle continues.
This type of environment is:
- ✅the BEST for trading breakouts
- ❌the WORST for trading reversals
🤓NOTE TO READER: This next concept had a huge impact not just on my trading but also in the overall quality of my decision-making. Of all the things discussed in this article, I hope this specific concept is the one that gets retained in your memory.
🧠 Margin of Error
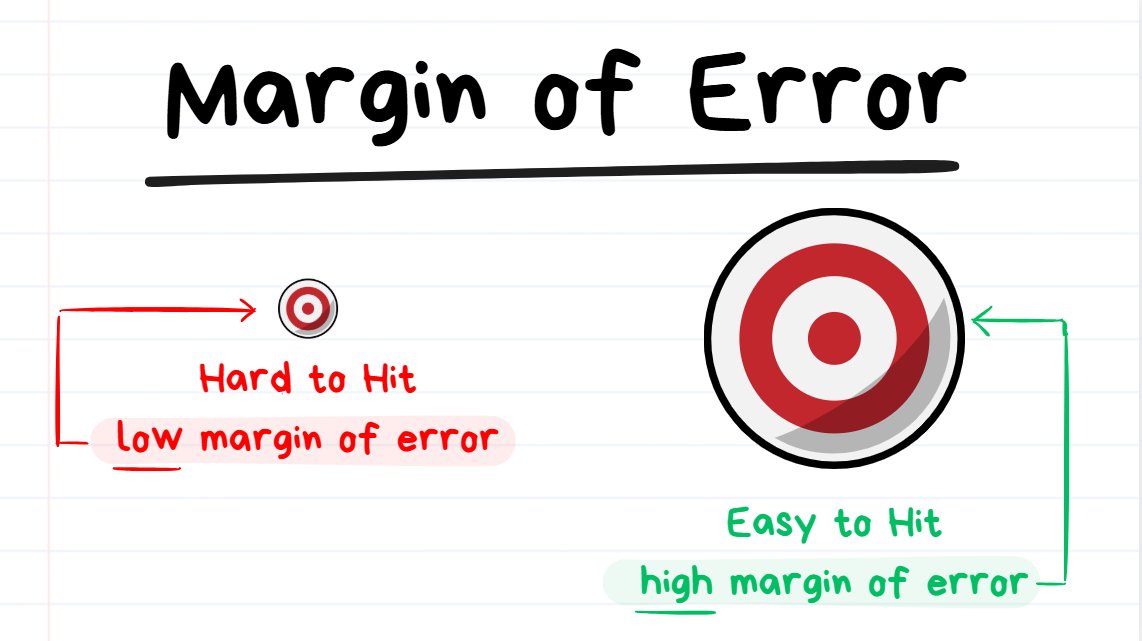
If your goal was “just hit the target”, it would make more sense to play on the 2nd Target rather than the 1st Target.
There is a reason why some environments are great for reversals and others are great for breakouts.
The reason is due to the “Margin of Error” that’s available.
- High Margin of Error = there’s a lot of breathing room for mistakes. You can make errors and still get away with it.
- Low Margin of Error = there is barely any breathing room for mistakes. You need perfect execution and even the slightest error will result in failure.
I want to quickly give the Poker analogy for this ↓
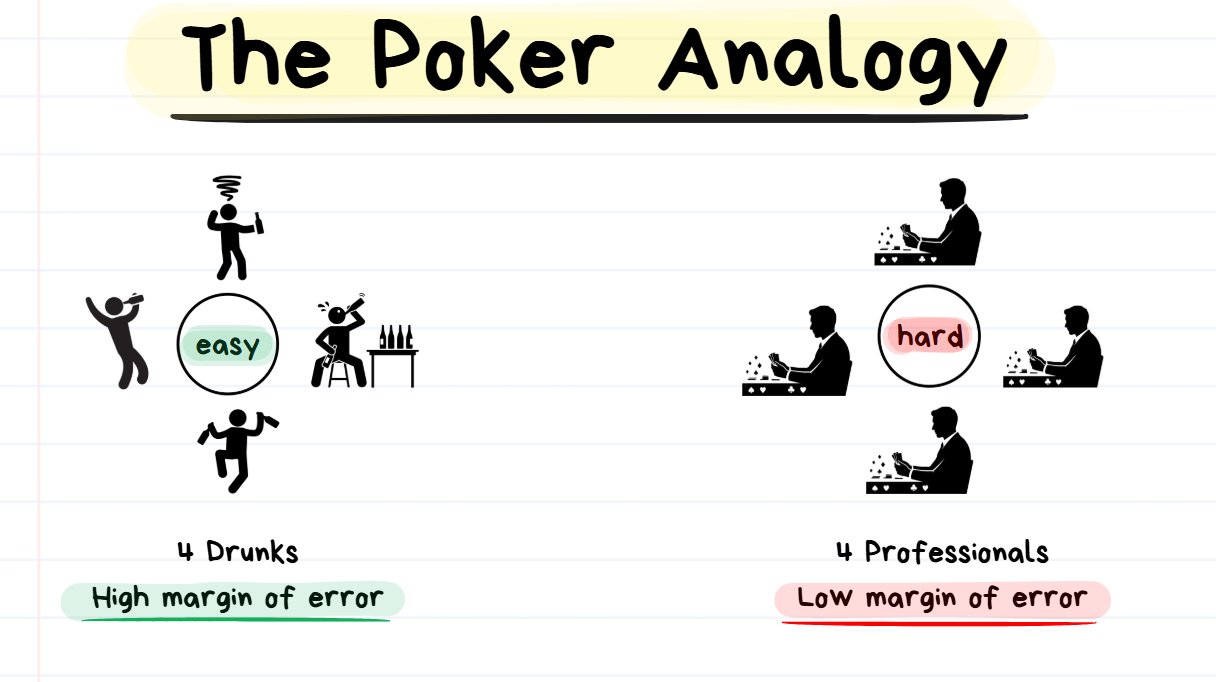
If your skill is the same but you play in an easier environment = you will have a higher earning potential.
- Saturday Night: Imagine playing Poker against 4 drunk players on a Saturday night
- Tuesday Morning: Imagine playing poker against 4 professionals on a Tuesday morning
Despite you having the exact same level of execution skill, it’s more likely that you perform better against the 4 Drunk Players rather than the 4 Professionals.
With the 4 Drunk Guys, you can make plenty of mistakes and you won’t be exploited for them. They will make plenty more errors than you, so you just have to be there to take advantage of the mistakes. Your margin of error is HIGH in this situation.
With the 4 Professionals, every mistake you make is a really big deal. You will be punished very harshly for every error and you will need to play perfectly. Your margin of error is LOW in this situation.
Imagine that BOTH situations (playing against the drunks or the pros) had the SAME PAYOUT… Then it would be a no-brainer to just only play against the drunks and to stay away from playing against pros.
🤓NOTE TO READER: Below I will explain how Margin of Error is relevant in Trading ↓
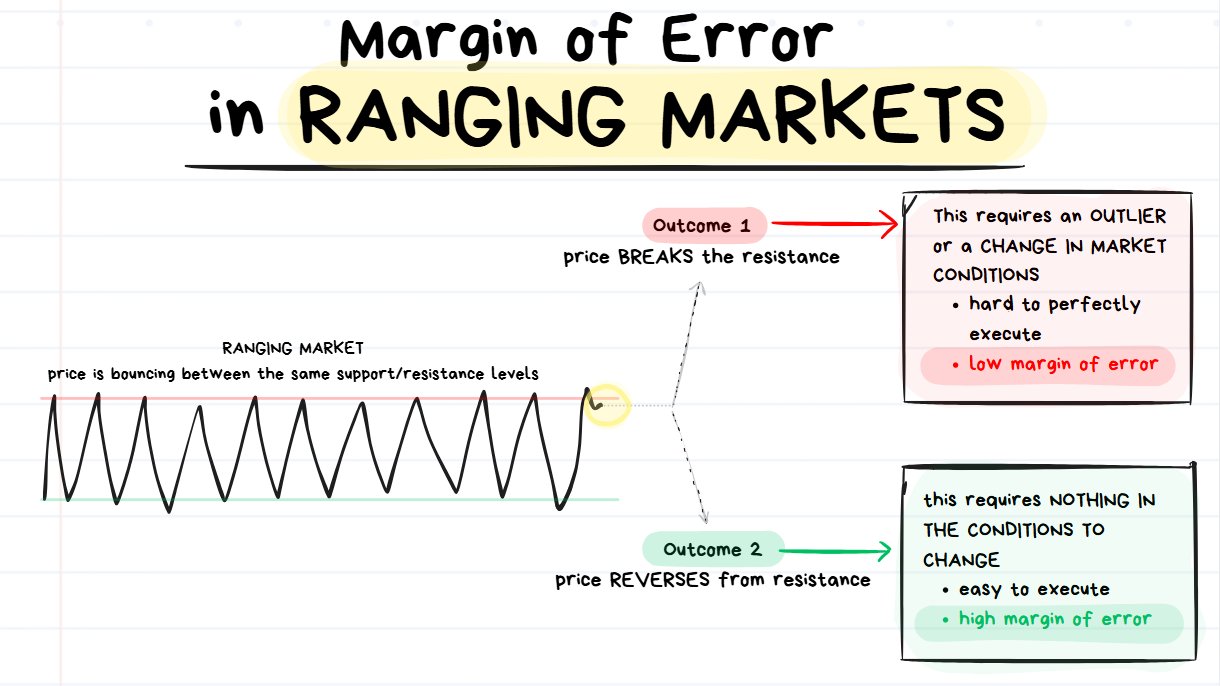
betting on Outcome #2 is easier than Outcome #1
When price is stuck in a range and then approaches a resistance level there are 2 possible things that can happen:
- OUTCOME #1: The market environment changes and price does something COMPLETELY DIFFERENT to before. The price BREAKS the level and shoots upwards. This has a low margin of error.
- OUTCOME #2: Nothing changes in the market environment. Price REVERSES from the level once again and moves down. This has a high margin of error.
Let’s compare the margin of error with playing the reversal and playing the breakout.
🎯Timing the ENTRY:
- Reversals: Whether you played the reversal on the 1st touch of resistance, the 2nd, 3rd, 4th…. 9th…. every single one of them would have been winners.
- Breakouts: If you went for the breakout every single time that price touched the resistance, every single trade would have failed and resulted in a loss.
🎯Timing the EXIT:
- Reversals: Every single trade that was taken as a short from resistance immediately started going down. This means that it doesn’t even matter how the exit is executed, almost every single variation of taking profit would work. “Close after 10 candles” = profitable. “Close once price reaches the next support level” = profitable. “Close at the midpoint of the range” = profitable. “Close with a Trailing SL in profit” = profitable… the point is that every variation of trying to exit the trade would likely work.
- Breakouts: Since every single trade that was taken as a long from resistance immediately started going down, exiting for a profit would be insanely difficult. The only way a trade would exit in profit is if the Trader was catching the small “blip” in price as price wicked through the level and they managed to close it just perfectly in time before it turned around… but even with this method they would be catching tiny scraps. All other variations of trying to exit a Breakout Trade on the previous price action would fail and result in losses.
THE POINT ↓
As we can see, this price action gives A LOT OF ROOM for mistakes when trading reversals and VERY LITTLE ROOM for mistakes when trading breakouts.
A low quality reversal strategy would perform very well in this environment however even a highly optimized breakout strategy would really struggle in this environment.
**🤓**NOTE TO READER: The little section below with the Trending Markets might sound a bit repetitive. I just really want to emphasize the point here.
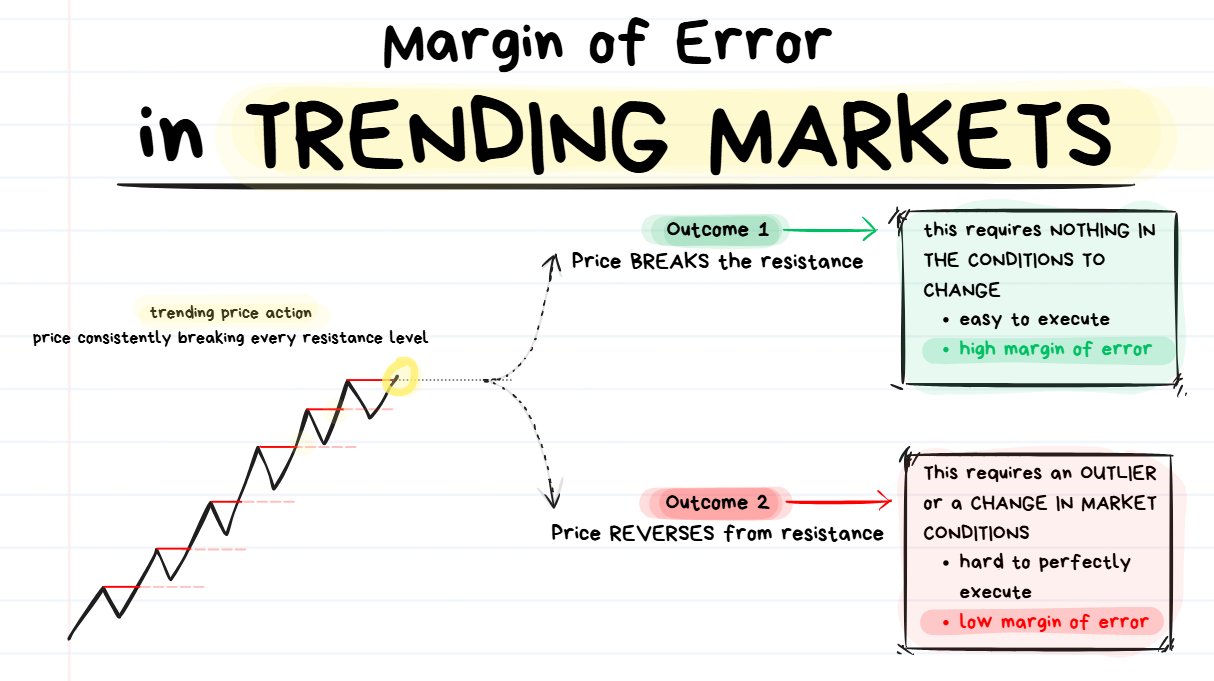
Betting on Outcome #1 is going to be easier than betting on Outcome #2.
When price is consistently trending in 1 direction and then approaches a resistance level there are 2 possible things that can happen:
- OUTCOME #1: The market environment changes and price does something COMPLETELY DIFFERENT to before. The price REVERSES from the level and falls down. This has a low margin of error.
- OUTCOME #2: Nothing changes in the market environment. Price BREAKS the level once again and continues to move upwards. This has a high margin of error.
Just like in the previous example, let’s compare the Margin of Error with both the outcomes.
**🎯**Timing the Entry:
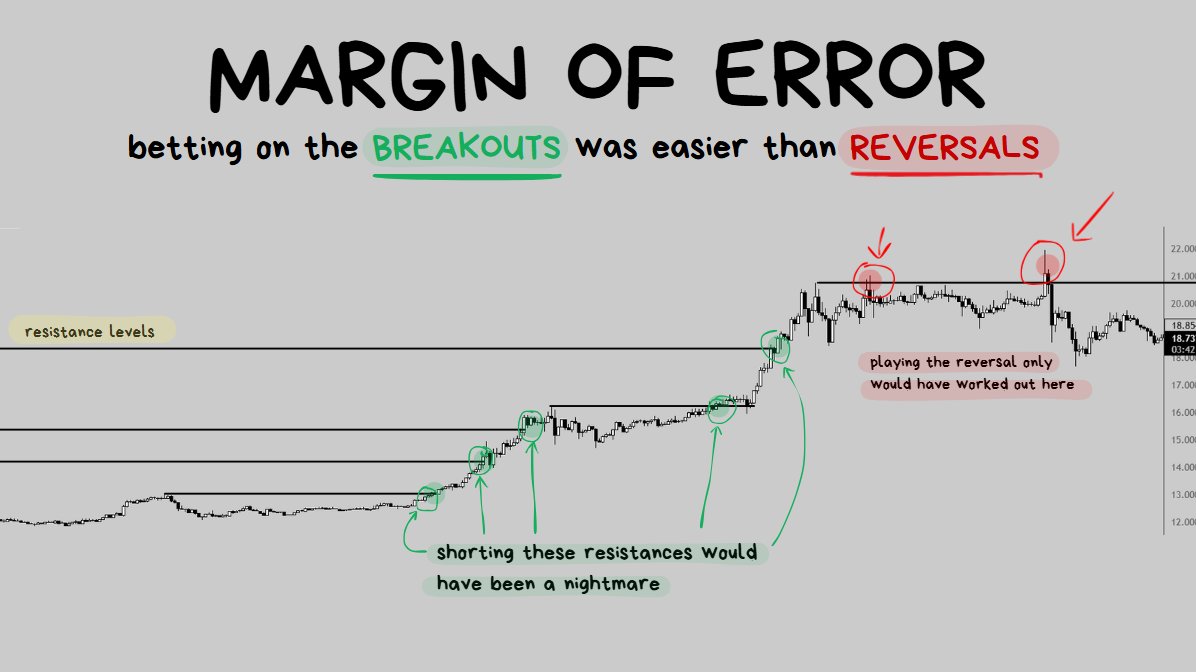
- Breakout: If you entered earlier or later, on the 1st level or the 2nd or 3rd… it wouldn’t matter. Every single time you would have went for the breakout you would have won. The only way you would lose the trade is if the A) the conditions change or B) You get unlucky with an “outlier spike” to the downside.
- Reversals: Every single attempt at shorting the resistance would fail. The only way you could win the next attempt at shorting resistance is if you get lucky with the conditions changing in your favor or if the price randomly spikes down. It will require perfect execution since your entry will need to be based on a “change of conditions” rather than “conditions remaining the same”, which is much more challenging to do.
🎯Timing the Exit:
- Breakouts: Again here even if you were ambitious with the targets or very conservative, you would win all of the breakout trade opportunities on the left. Even if you were looking to exit with a trailing SL or something else like a MA crossover, you would likely exit with a winning trade regardless of what settings you put in your indicator or trailing SL.
- Reversals: Either you would need to go for really perfect/precise tiny winners to snipe the tiny pullbacks (which would be very dangerous and hard to do) or you will need a really clean exit if the conditions were to change. Basically shorting all of the resistances on the left hand side would be very difficult to do successfully.
Summary: Lesson 3
Every trade fits one of three decisions: 1️⃣→ Bet on a breakout (momentum). 2️⃣→ Bet on a bounce (mean reversion). 3️⃣→ Take no trade.
Your job as a Trader: identify the environment and choose the option with the highest margin of error (most room for mistakes).
1. Market Structure
- Bullish: higher highs + higher lows
- Bearish: lower lows + lower highs
- Break of structure: confirmed only when price breaches the most recent swing high/low.
2. Market Environments
A. Mean-Reverting (Ranging)
- Price repeatedly bounces between similar highs/lows.
- ✅ Best for reversals
- ❌ Worst for breakouts
B. Momentum (Trending)
- Price consistently breaks through levels and continues in one direction.
- ✅ Best for breakouts
- ❌ Worst for reversals
3. Margin of Error 🧠
- High margin of error: Easy environment, you can be imperfect and still win.
- Low margin of error: Hard environment, one mistake and you lose. Think poker: playing against drunks (easy) vs pros (hard). You want to trade where mistakes are forgiven.
4. Applying It
In ranges → reversals have high margin of error. In trends → breakouts have high margin of error. Trade with the environment, not against it.
🤓NOTE TO READER: Well done for pushing this far into the article. Just 1 final lesson to go. ↓
Lesson 4: Live Trade Examples + 5 Bonus Resources
So I’m getting really close to the image limit on this Article (yes… X articles have image limits) so unfortunately I can’t ramble on with more theory.
This final Lesson will include:
- Live Trade Examples and Explanations
- 5 Bonus Resources on Price Action related concepts
Live Trade Examples and Explanations
⚠️Quick Disclaimer: I have “cherry-picked” winning trade screenshots below. I can assure you that I do not have a 100% winrate , it’s actually sitting somewhere between 55-60%~.
🤔Quick Context: There are many influencers who say things like “you should only be shorting resistance, longing it is stupid!” Unfortunately they don’t have a clue what they’re talking about. Under specific circumstances (when margin of error is really low) shorting resistance can be a really bad idea. I want to emphasize this with 5 examples below.
Trade 1: Momentum Long
Jul 18, 2023
target hit +1.99% ty
Price was consistently breaking resistances over and over again.
The play here was “whatever was happening, I’m going to bet that nothing is going to change and it’s just going to keep happening.”
Extra Confluences:
- price action looked like a “slow grindy staircase” (good for breakouts, bad for reversals)
- the volume was increasing over time (good for breakouts, bad for reversals)
Trade #2: Momentum Long
Jul 18, 2023
first trade hit target, +1.58% ty, next please
Looks pretty much identical to the trade above:
- Slow grindy staircase price action
- Price breaking out of every visible resistance on the left hand side
- Consistently increasing volume over time
This is a perfect example of “would rather be long until I’m wrong rather than short until I’m right.”
All Traders who were furiously shorting every resistance were not having a fun time during this trend.
Trade #3: Momentum Long
Jun 22, 2023
target hit +5.6% next please
This one is a bit more of a “steeper” and “more extreme” example, but the concept remains the same.
- The market structure was bullish (higher highs and higher lows)
- Price kept slicing through every resistance like a hot knife going through butter
- Volume was consistently increasing over time
Margin of error for breakout trading was very high but for reversals it was very low.
Even if I botched the entry and mistimed the exit the market would have rewarded me… but for trading the reversal I would need absolute perfect and very precise execution.
Trade #4: Momentum Long
Jul 10, 2023
target hit +6.7% tyvm
You must be tired of seeing the exact same price action, same thing in volume, same behavior of price exploding through every visible resistance…
… if yes, then get used to it because this is how consistent execution feels like.
Taking the exact same trade in the same conditions with similar outcomes over and over again.
I’m trying to drill the repetition here to show that these specific scenarios are generally VERY UNFAVORABLE for going for the reversal trade which inversely makes it VERY FAVORABLE to attempt going for the breakout instead.
Trade #5: Momentum Long
Jun 4, 2023
Target hit +1.59% onto the next
Same exact thing. Margin of error is really high on this one.
- I could have entered a few candles earlier, a few candles later…
- I could have exited a little bit earlier or a little bit later
- I could have used a slightly different timeframe
- .. and most of the variations of how this trade could have possibly been taken likely would have ended up as a winner.
Staircase-like price action (cleanly breaking through every resistance) on increasing volume is REALLY NICE for trading breakouts and I will continue to repeat it over and over again.
🤓NOTE TO READER: Hopefully my words and this price action pattern gets tattooed into your memory.
5 Bonus Resources on Price Action
Below I’m going to dump 5 Bonus resources/materials which you may find helpful.
Enjoy! ↓
1. How I trade Breakouts
Jul 31, 2025
2. How I trade Reversals
Oct 1, 2025
3. How I use Crypto Screeners to make it easier to tell if I should be focusing on Breakouts or Reversals
Oct 14, 2025
4. Volume Masterclass
Oct 23, 2025
5. Thread on Price-Action Confirmations
Oct 14, 2025
Trade Entry “Confirmations” I notice traders regularly asking questions about this topic Here’s a small Thread of some Resources: (1/4)
Article Summary
Lesson 1: How Price Actually Moves
- Price moves because of supply and demand, not secret algorithms.
- Makers = limit orders that add liquidity.
- Takers = market orders that consume liquidity.
- When market orders eat through the limit orders at one price, price shifts to the next.
- In short: 👉 Price = the result of market orders hitting the orderbook.
Lesson 2: Support & Resistance
- S/R levels aren’t magical lines, they’re zones where clusters of limit orders sit.
- Price reacts violently when big limit orders are hit.
- It’s not about “strong” or “weak” levels; it’s about how much money is sitting there.
- Round numbers and previous highs/lows attract heavy order flow.
- Key setups: Daily highs/lows = consistent and reactive. 1-hour highs/lows = great for intraday trades.
- 👉 Focus on liquidity clusters, not artistic lines.
Lesson 3: Ranging vs Trending Structure
- Every trade decision = 1️⃣ Bet on a breakout (momentum) 2️⃣ Bet on a bounce (mean reversion) 3️⃣ Don’t trade
- Bullish structure = higher highs/lows. Bearish structure = lower highs/lows. A break in structure = breach of the last swing high/low.
- Ranging markets: best for reversals, worst for breakouts.
- Trending markets: best for breakouts, worst for reversals.
🧠 Margin of Error Concept
- Some environments forgive mistakes; others punish them.
- High margin of error = easy to win even with sloppy execution.
- Low margin of error = need perfect timing.
- Like poker: trading against drunk players (forgiving) vs pros (punishing).
- In ranges → reversals have higher margin of error.
- In trends → breakouts have higher margin of error. 👉 Trade where mistakes are forgiven, not where precision is mandatory.
Lesson 4: Live Trade Examples + 5 Bonus Resources
- Real trades illustrate repetition and consistency: “Same setup, same behavior, same outcome.”
- Breakout longs during trending markets show: Staircase price action. Increasing volume. High margin of error = even imperfect entries/exits work.
- The point: You make consistent money by repeatedly executing the same high-probability setups in forgiving environments.
I am very grateful to you for giving me your Time and Attention, your 2 most valuable assets.

🌶️
Source
Written by @spicyofc · View original post · Published: 2025-09-02